
Merzouga weather: read the regional climate carefully
Merzouga weather changes the way you plan time outdoors, but a monthly climate table serves a different purpose from a forecast. The figures on this page come from the station at Errachidia. They describe the climate normal period 1991 to 2020, using the Moroccan weather service’s data distributed by the WMO World Weather Information Service. The monthly records were transmitted on 14 August 2023.
These are historical regional reference values. They are not a measurement series from Merzouga itself, a prediction for your travel dates or the temperature inside a camp tent. Use them to compare months and understand what the columns mean. For the actual day of a ride or overnight stay, consult the current forecast and the arrangements for the specific activity you intend to join.
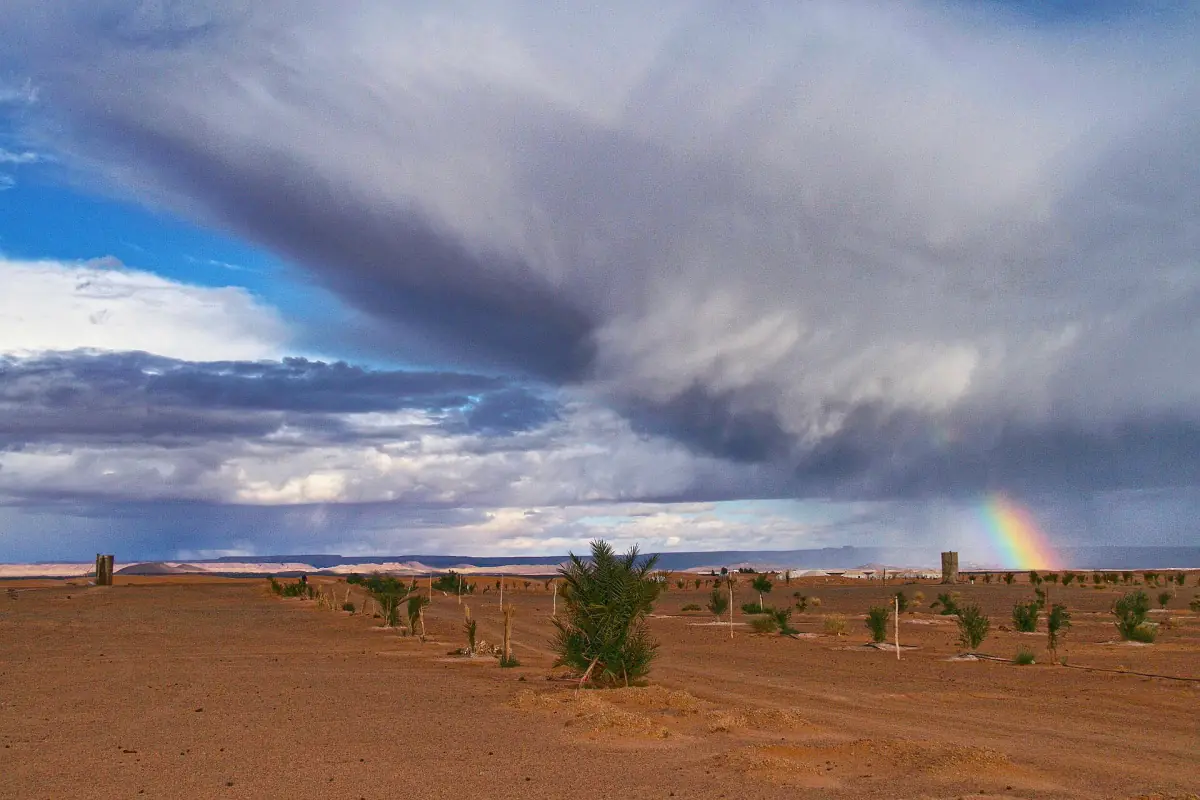
Monthly climate normals for Errachidia
The maximum column is the mean daily highest temperature for that month; the minimum column is the mean daily lowest temperature. Neither is an absolute record. A monthly high does not mean that every afternoon reaches that value, and a monthly low does not mean every night has the same temperature. Read the columns together when you are comparing an afternoon activity with an early morning departure.
Rainfall is the mean monthly total, expressed in millimetres. It is not a daily allowance of rain or a promise about the timing of showers. The complete table keeps all twelve months within the same normal period and the same station, so you can compare like with like. Do not use a low rainfall average as a decision about the condition of a road or access to a camp.
| Month | Mean daily maximum °C | Mean daily minimum °C | Mean monthly rainfall mm |
|---|---|---|---|
| January | 15.9 | 2.0 | 10.0 |
| February | 18.2 | 4.6 | 12.6 |
| March | 22.1 | 8.8 | 14.0 |
| April | 26.1 | 13.0 | 9.4 |
| May | 30.3 | 17.3 | 8.7 |
| June | 35.4 | 22.0 | 5.6 |
| July | 39.5 | 25.8 | 3.1 |
| August | 38.2 | 24.9 | 6.3 |
| September | 32.9 | 19.9 | 18.2 |
| October | 26.8 | 14.2 | 23.7 |
| November | 20.6 | 7.7 | 16.3 |
| December | 16.7 | 3.5 | 8.0 |
Guided quad outing
For this quad outing, check the weather and conditions before departure.
Hand-picked tours, booked through Viator. Prices are indicative starting prices in euros (as of October 2026). Tap a tour for live availability and the current price in your currency.
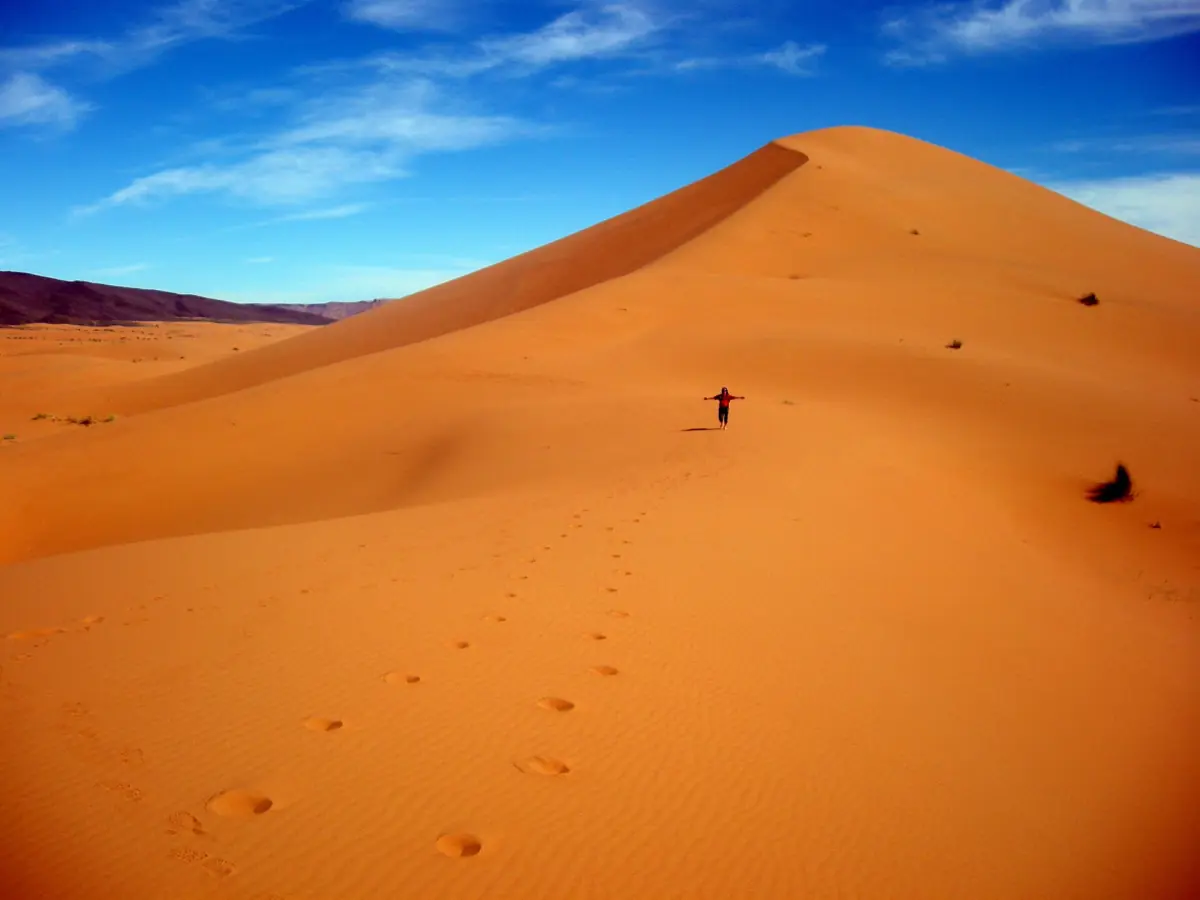
A guided hour on a quad
This local quad option includes a professional guide, an ATV and a helmet; choose the date alongside the forecast and the activity’s own terms.
Daytime heat, winter nights and your itinerary
The Errachidia normals show a July mean daily maximum of 39.5 °C and a January mean daily minimum of 2.0 °C. Both values belong to 1991 to 2020, with transmission in 2023. They illustrate seasonal contrasts; they are not maximum and minimum limits for a future visit. An overnight itinerary needs attention to the evening and morning as well as the main daytime outing.
The ONMT describes the desert summer as very hot and winter nights as cold. For a decision about which season fits your plans, continue to the best time to visit. That page relates the season to camp nights and travel schedules, rather than repeating this table. A general seasonal recommendation and a forecast answer different questions, and neither describes the equipment in a particular tent.
Wind and a guided quad activity
A motorised outing is a specific booking with its own arrangements. The one-hour quad experience shown here includes a professional guide, the ATV and a helmet. It gives you a guided activity to consider alongside the forecast. Discuss the proposed departure and conditions for your date; use the forecast and the activity’s arrangements to assess a particular outdoor session.
Keep the cancellation and weather terms attached to the activity you select. A rule offered by another business is not a rule for every quad ride in Merzouga. The helmet and guide are concrete included features of this option. For a broader comparison of local activities, use the quad and sandboarding guide, keeping the included services of each product separate.
From a monthly table to a practical plan
Begin with the month, then add the time outdoors and the overnight arrangements. Someone comparing daytime activities will read the table differently from someone arranging a tent and a sunrise departure. Neither should read a monthly minimum as a guaranteed temperature at a meeting point. Let the current forecast guide the final preparation for your dates, while the historical table supplies context for the earlier planning decision.
Use the arrival guide to separate the road journey from the final approach to your accommodation. Weather statistics do not establish current road conditions. For overnight choices, the desert camp page explains specific accommodation features. Match those features to the actual booking rather than treating the word camp as a description of heating, cooling or bathroom arrangements.
Questions before you go
Are these measurements from Merzouga?
The full monthly table is for Errachidia station. It uses climate normals for 1991 to 2020, transmitted on 14 August 2023, as regional context for planning.
Does the monthly minimum predict my camp night?
It is a historical mean daily minimum at the station, rather than a forecast or an indoor temperature. Consult the forecast for your dates and the equipment details of your tent.
Does little average rain mean roads will be open?
Use current journey information for the road route. A historical monthly rainfall total describes climate; use current information for a particular road or camp approach.